


Market Analysis Review
GOLD – Can the breach of $2020 be held? - Weaker USD, Yields and Inflation
XAUUSD, Daily
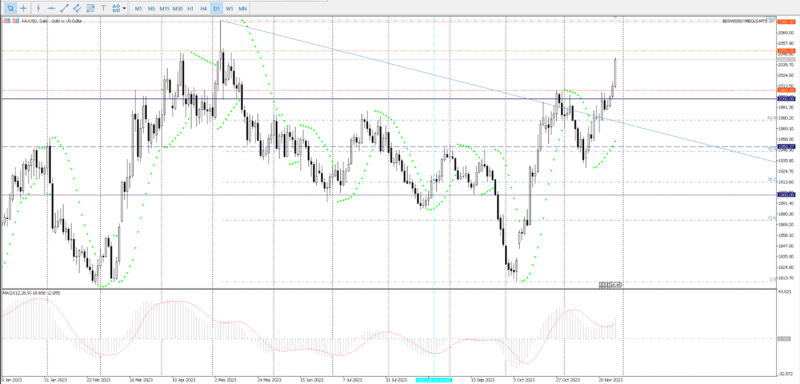
The Gold chart turned to the upside last week, with a breach and break of $1990 and the key $2000 level. Last Tuesday, (November 21) was a big upside day. Yesterday (November 28) the market pushed over $2020 and even $2040. The recent October high sat at $2009 and the Spring high from May was $2015. Beyond $2040 sits the 161.8 Fibonacci Extension from the late October high to the November low leg which sits around the $2050 level. The 2023 high from early May tested to $2080 intra-day and is co-located around the 2020 and 2022 highs.
Daily resistance now becomes support, which is found at $2009, $2000 and the 21-day moving average at $1982.
A weaker trending USD (USDIndex closed below 103.00 yesterday (November 28) for the first time since August 11) and US Treasury Yields (10-year rate closed at 4.336 yesterday) have added to the attraction of the Gold. More key data to come this week. Today is the first revision of the US Q3 GDP (November 29), tomorrow (November 30) we will look into the Fed’s preferred measure of inflation – Personal Consumption Expenditures along with all the month-end rebalancing of portfolios that it brings and finally on Friday (December 1) a key speech from Fed Chair Powell.
XAUUSD, Daily
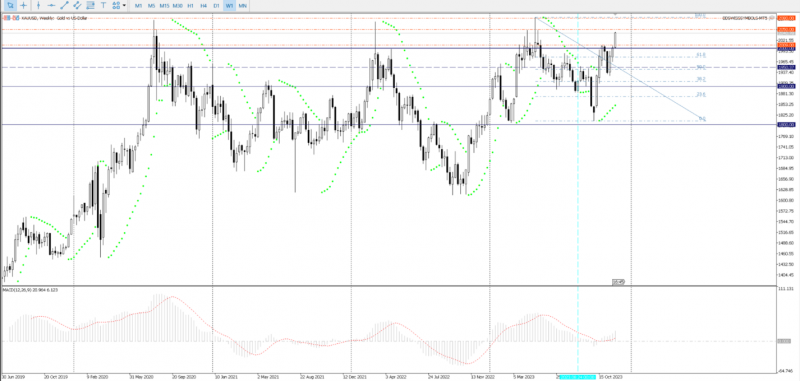
XAUUSD, Weekly
 Stuart Cowell
Recent Posts
Posted on 02 May, 2025 at 12:00 GMT
Posted on 29 April, 2025 at 12:00 GMT
Posted on 28 April, 2025 at 12:00 GMT
Posted on 25 April, 2025 at 12:00 GMT
Posted on 23 April, 2025 at 11:00 GMT