


Technical Analysis Post
Analyzing the Potential Impact of US Core PCE Price Index on the Market
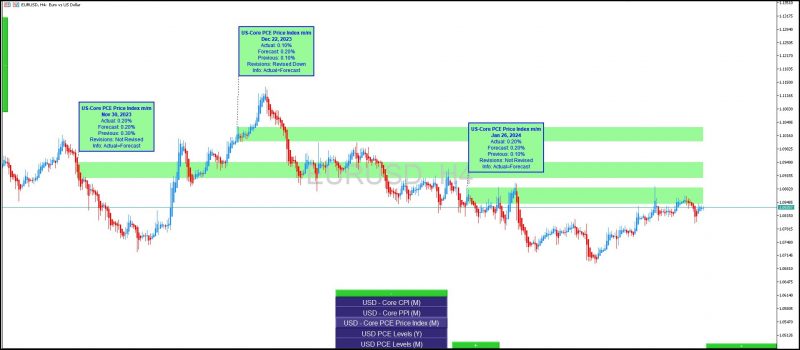
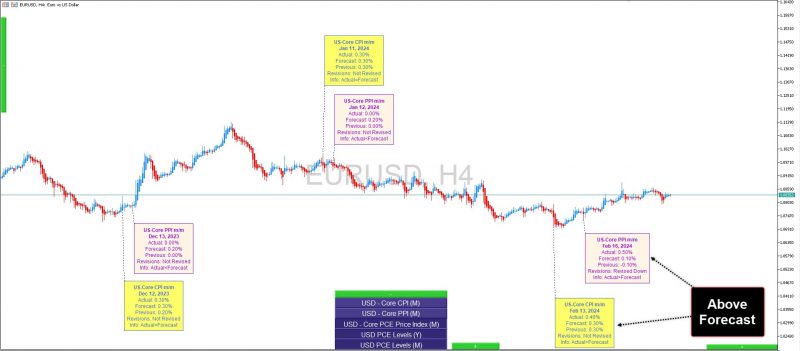
“The markets are eagerly anticipating the release of the US Core PCE Price Index data, a crucial inflation indicator.” CPI and PPI reports recently went up. This leads us to expect a rise in the PCE figures.However, the real question on everyone’s mind is: what happens if the actual print deviates significantly from these expectations?
Scenario 1: High US Core PCE Price Index
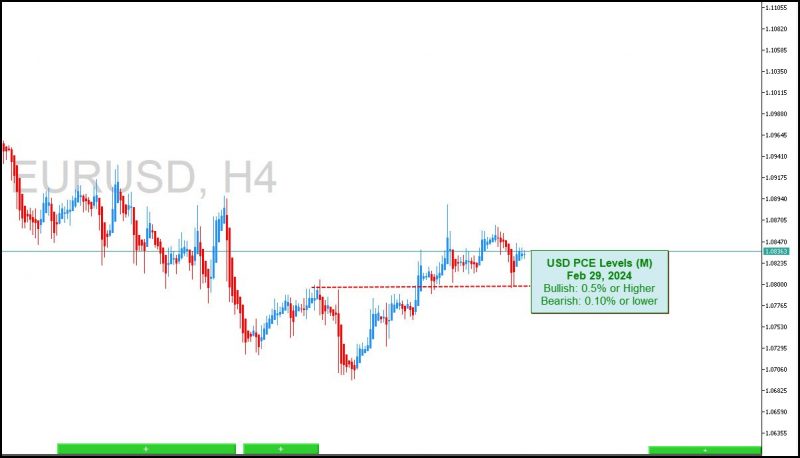
In the event that the US Core PCE Price Index exceeds expectations, with a m/m increase of 0.5% or higher and a y/y rise of 2.5% or more, we could witness a shift in market sentiment. A high reading might prompt the Federal Reserve to adopt a more aggressive stance on interest rates, potentially leading to a strengthening of the USD. This outcome would align with expectations of tightening monetary policy to combat inflationary pressures.
Scenario 2: Low US Core PCE Price Index
Conversely, if the US Core PCE Price Index falls below expectations, with a m/m increase at 0.10% or lower and a y/y figure at 2.10% or below, we might see a different market reaction. A lower-than-anticipated print could signal weaker inflationary pressures, potentially resulting in a depreciation of the USD. This scenario could reignite speculations about the possibility of earlier rate cuts by the Federal Reserve to support economic growth.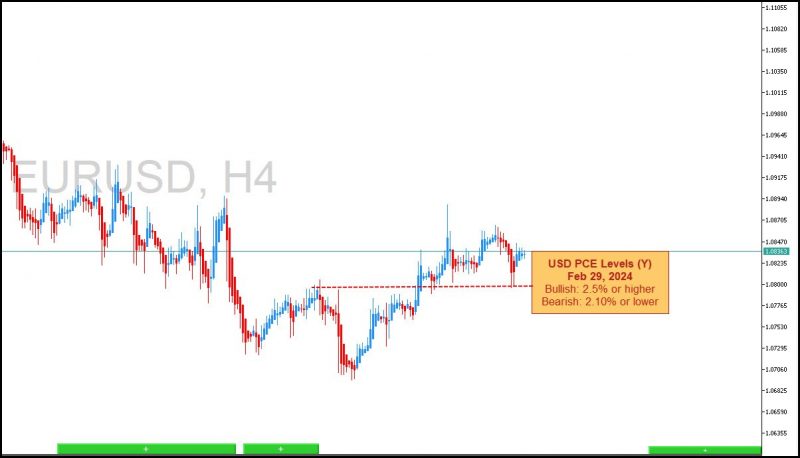
Technicals
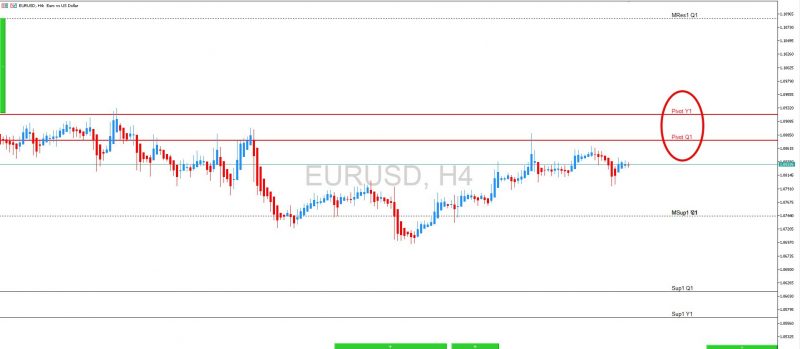
The yearly and quarterly pivot points mark the closest level of resistance. It is within a range of only 90 pips. The support level is at 76% Fibonacci retracement, which is the middle quarterly support level as well.
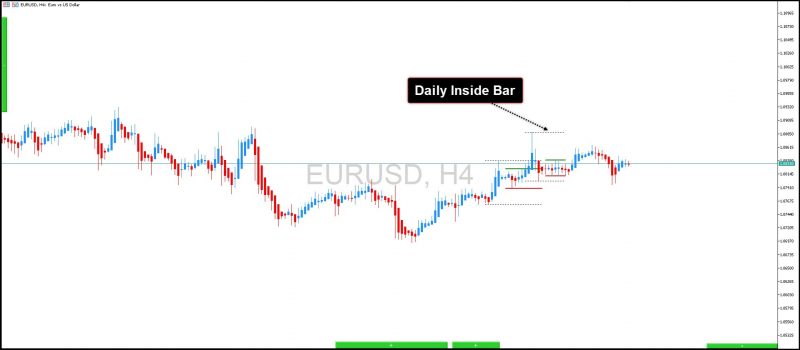
 Furthermore, the market is currently in the inside bar formation from February 22nd.
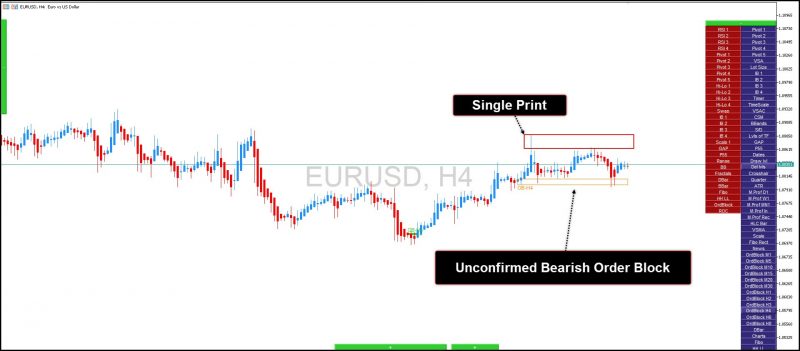
 There is an unconfirmed order block at the low of February 28th, which may be validated by a strengthening USD and trigger a bearish reaction.It also lays on a level of key support and resistance.
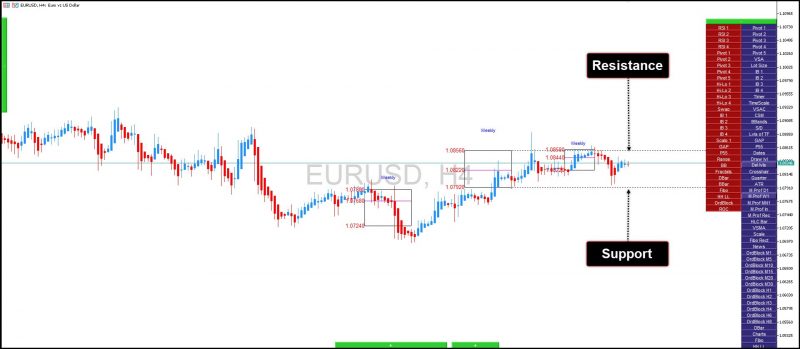
 Regarding the weekly market profile levels, the market opened this week within the value area of the previous week. As a result, the highs and lows of last week’s value areas have the potential to act as significant support and resistance levels for this week.
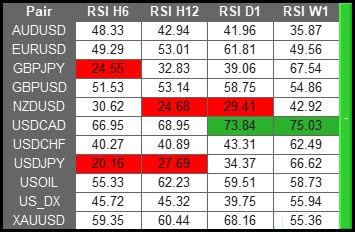
 RSI Overbought/Oversold Levels at the time of writing.
 Adnan Rehman
Recent Posts
Posted on 02 May, 2025 at 12:00 GMT
Posted on 29 April, 2025 at 12:00 GMT
Posted on 28 April, 2025 at 12:00 GMT
Posted on 25 April, 2025 at 12:00 GMT
Posted on 23 April, 2025 at 11:00 GMT