Weekly Outlook
U.S. Consumer Confidence dropped, U.S. Manufacturing Goods orders fell, Canada’s and Australia’s Inflation higher, Core PCE Inflation at 0.1% as expected, NFP ahead
PREVIOUS WEEK’S EVENTS (Week 24- 28.06.2024)
U.S. Economy
U.S. consumer confidence eased in June amid worries about the economic outlook. The Conference Board’s consumer confidence index dipped to 100.4 this month from a downwardly revised 101.3 in May. Important to note that consumers’ perceived likelihood of a recession over the next 12 months retreated this month after rising in April and May.
The drop in confidence was concentrated in the 35-54 age group. Confidence improved among consumers under 35 and those 55 years and older.
New orders for key U.S.- manufactured capital goods unexpectedly fell in May, suggesting that business spending on equipment weakened in the second quarter as borrowing costs remained elevated. Business spending on equipment is under pressure from higher interest rates and softening demand for goods.
The Federal Reserve has maintained its benchmark overnight interest rate in the current 5.25%-5.50% range since last July. Financial markets expect the U.S. central bank to start its easing cycle in September, though policymakers recently adopted a more hawkish outlook.
______________________________________________________________________
Inflation
Canada
Inflation in Canada turned surprisingly to the upside in May, after showing signs of an almost consistent cooling since the start of the year. The annual inflation rate accelerated to 2.9% in May from 2.7% a month ago. The Bank of Canada, which cut interest rates for the first time in four years this month, has repeatedly maintained that the path towards further easing of rates would be data-dependent.
Australia
Australian consumer inflation accelerated to a six-month high in May, raising the chances of another interest rate hike this year. This happens while other central banks already proceeded with cuts. The consumer price index (CPI) rose at an annual pace of 4.0% in May, up from 3.6% in April and well above market forecasts of 3.8%.
A closely watched measure of core inflation, the trimmed mean, climbed to an annual 4.4%, also its highest level in six months and up from 4.1%.
U.S.
Last Friday’s inflation-related report showed that U.S. monthly inflation was unchanged in May. The flat reading in the personal consumption expenditures (PCE) price index last month followed an unrevised 0.3% gain in April. It was the first time in six months that PCE inflation was unchanged.
Consumer spending rose marginally last month. Underlying prices advanced at the slowest pace in six months. Traders raised their bets for a Fed rate cut in September.
In the 12 months through May, the PCE price index increased 2.6% after advancing 2.7% in April. Last month’s inflation readings were in line with economists’ expectations.
The so-called core PCE price index was previously reported to have climbed 0.2% in April. Core inflation increased 2.6% on a year-on-year basis in May, the smallest advance since March 2021, after rising 2.8% in April.
The Fed tracks the PCE price measures for its inflation target. Monthly inflation readings of 0.2% over time are necessary to bring inflation back to target.
PCE services inflation excluding energy and housing also ticked up 0.1% last month after advancing 0.3% in April. This measure is being watched by policymakers to measure progress in lowering price pressures.
______________________________________________________________________
Sources:
https://www.reuters.com/markets/us/us-core-capital-goods-orders-fall-sharply-may-2024-06-27/
https://www.reuters.com/markets/us/us-consumer-confidence-ebbs-slightly-june-2024-06-25/
_____________________________________________________________________________________________
Currency Markets Impact – Past Releases (Week 24- 28.06.2024)
Server Time / Timezone EEST (UTC+03:00)


Currency Markets Impact:
_____________________________________________________________________________________________
FOREX MARKETS MONITOR
Dollar Index (US_DX)
Interesting week for the U.S. dollar as it experienced appreciation in general until the end of the month. It was on the 25th that the index got a boost to the upside. We already know that the U.S. delayed rate cuts and inflation reports are not supporting the cuts as much as they should. This is the case when other central banks have actually proceeded with cuts. High interest rates in the U.S. kept USD attractive and strong. After finding resistance near the 106.16, the index slowed down and started to move sideways. The news during the week showed a cooling in manufacturing good orders, lower PCE Price inflation and indicated a potential future weakness of the currency. On the 1st of July, the USD eventually weakened significantly, thus the dollar index opened the secession with a gap downwards. Is it sustainable though?
 EURUSD
The pair was moving downwards while being under the 30-period MA since the 25th. Obviously driven by the USD. Not to forget that the ECB proceeded with cuts already and the EUR could have some pressure for weakening against other currencies. However, the elections in France are having a major impact on the market, affecting both currencies significantly. The dollar started to depreciate mid-week and the EURUSD moved to the upside steadily until the end of the month. However, on the 1st of July, the EUR appreciated heavily and the USD weakened further, causing a jump for the EURUSD.
 USDJPY
The recent and long JPY weakening caused the JPY pairs (JPY as quote currency) to move higher and higher. From the 25th of June, the USDJPY has moved significantly higher reaching critical levels, levels seen as peak before the BOJ intervention that strengthened the JPY heavily. The BOJ interventions had caused the USDJPY to drop significantly but the effect did not last. The USDJPY moved again to the upside. As depicted on the chart, despite overall USD weakening the pair managed to reach 161.3. Currently, volatility levels have lowered and a triangle formation is apparent. Without any intervention taking place, the USDJPY could see a re-test of the 161.3 level.
 _____________________________________________________________________________________________
CRYPTO MARKETS MONITOR
BTCUSD
On the 24th of June, Monday, Bitcoin plunged to 58,400 before retracing to the 61.8 Fibo level and settling near the 30-period MA, very close to 61K USD. Since the 27th, the price moved sideways around the mean near 61K USD. That changed on the 30th of June when the price eventually moved rapidly upwards breaking the 62K resistance and reaching until the next resistance near the 63,600 USD level before starting to retrace. A big recovery for Bitcoin compared with the latest moves. The 62,500 USD level could serve as the next target level if the retracement continues.
 _____________________________________________________________________________________________
NEXT WEEK’S EVENTS (Week 01 – 05.07.2024)
Coming up:

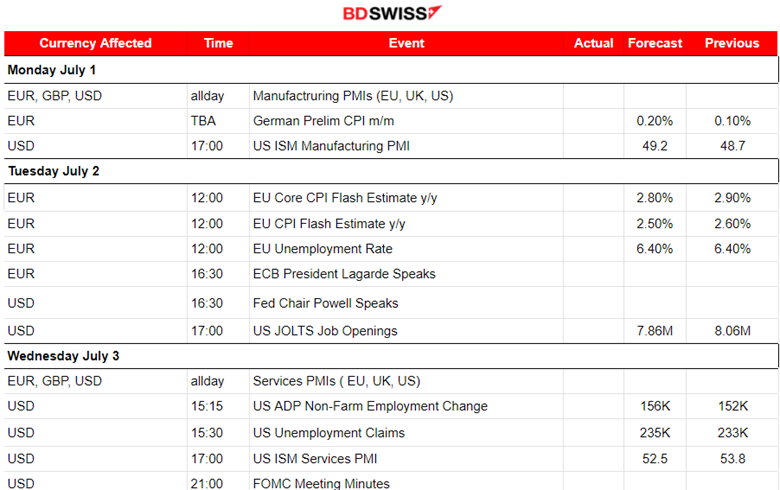
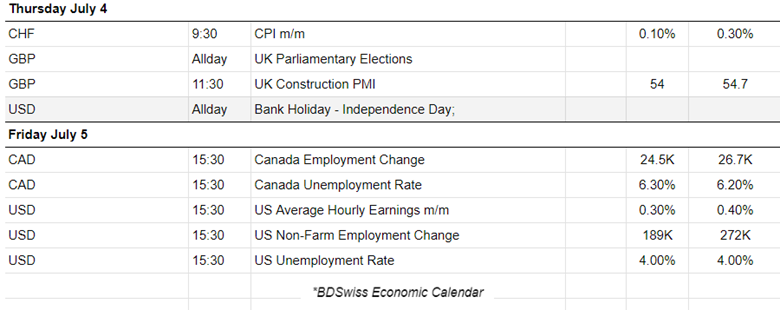
 Currency Markets Impact:
_____________________________________________________________________________________________
COMMODITIES MARKETS MONITOR
U.S. Crude Oil
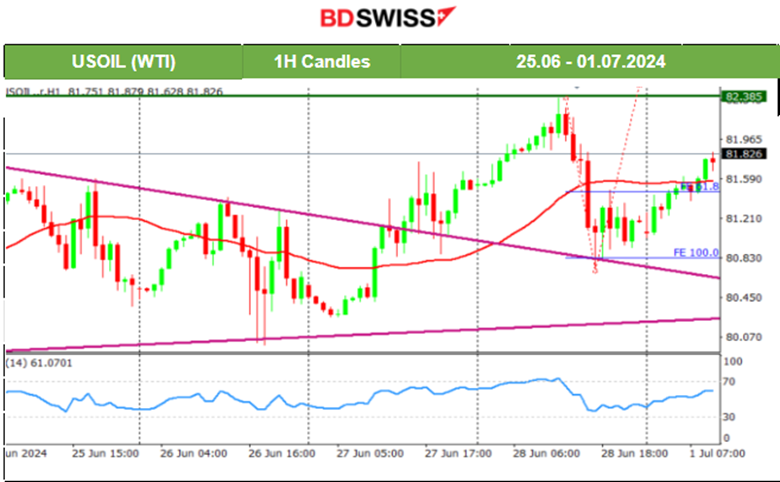
On the 26th, the price tested the support near 80 USD/b without success and retraced back to the MA. Max near 1 USD deviation from the mean. However, on the 27th the resistance at 81.7 USD/b broke and Crude oil got a boost, passing the 82 USD/b. It was a quite rapid movement to the upside after that breakout. The price eventually found resistance at near 82.40 USD/b before the price plunged on the 28th by near 1.5 USD/b around 13:00 server time. That was a big dive to 80.70 USD/b and retracement followed soon after reaching the 61.8 Fibo level and back to the 30-period MA. With volatility levels lowering, the path seems sideways for now.
 Gold (XAUUSD)
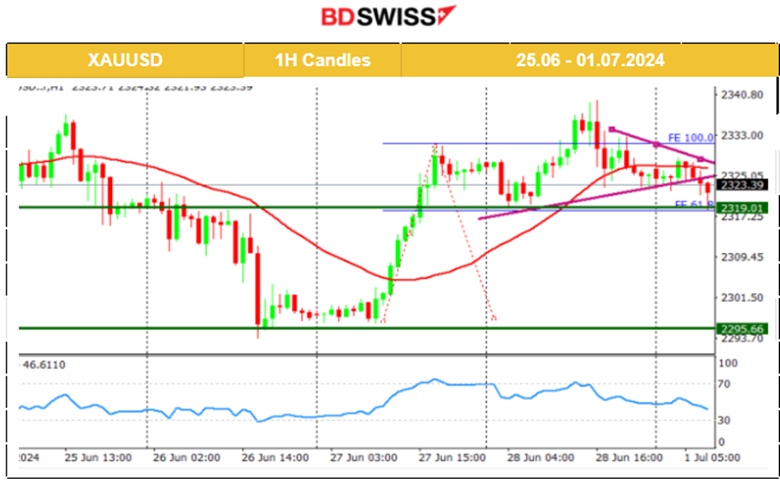
On the 25th, the price dropped after breaking a triangle formation and moved lower, remaining below the 30-period MA. The trend eventually continued and Gold moved to the downside. USD appreciation helped. On the 26th, the price broke important support levels and moved lower rapidly to 2,293 USD/oz before retracement took place and settled at 2,300 USD/oz. A triangle breach on the 27th caused it to jump. As mentioned in our previous analysis the price of 2,330 USD/oz was reached and acted as a resistance. The price retraced, reaching the 61.8 Fibo level. On the 28th the price experienced volatility but closed near flat. Looks like a sideways movement for now, even though a triangle formation is visible with a breakout. The next target could be 2,319 USD/oz again for re-testing and possible breakout. If the USD appreciates, that could help with the breakout.
 _____________________________________________________________________________________________
EQUITY MARKETS MONITOR
S&P500 (SPX500)
Price Movement
On the 26th, the index tested the resistance near 5,496 without success and retraced to the MA continuing the path sideways. On the 28th breakout of the 5,500 resistance led finally to an upward movement continuation of the index. The index found a strong resistance near 5,530 USD before it started to drop significantly, reversing from the upside, crossing the 30-period MA on the way down and reaching the support area near 5,500 USD again without a successful breakout. Currently, it remains below the MA with the potential of a re-test.

______________________________________________________________

